
Free Manpower Loading Chart Template for Excel, No Email Required
A manpower loading chart template is a spreadsheet that spreads each activity's labor hours across the weeks it runs, so you can see how many workers your trade needs on site each week. This one is free, needs no email address, and opens in Excel.
Download the manpower loading chart template (.xlsx, 74 KB)
What is inside the template?
Five sheets, filled in with a worked example (a drywall and ceilings subcontractor on a six-story building) that you type over:
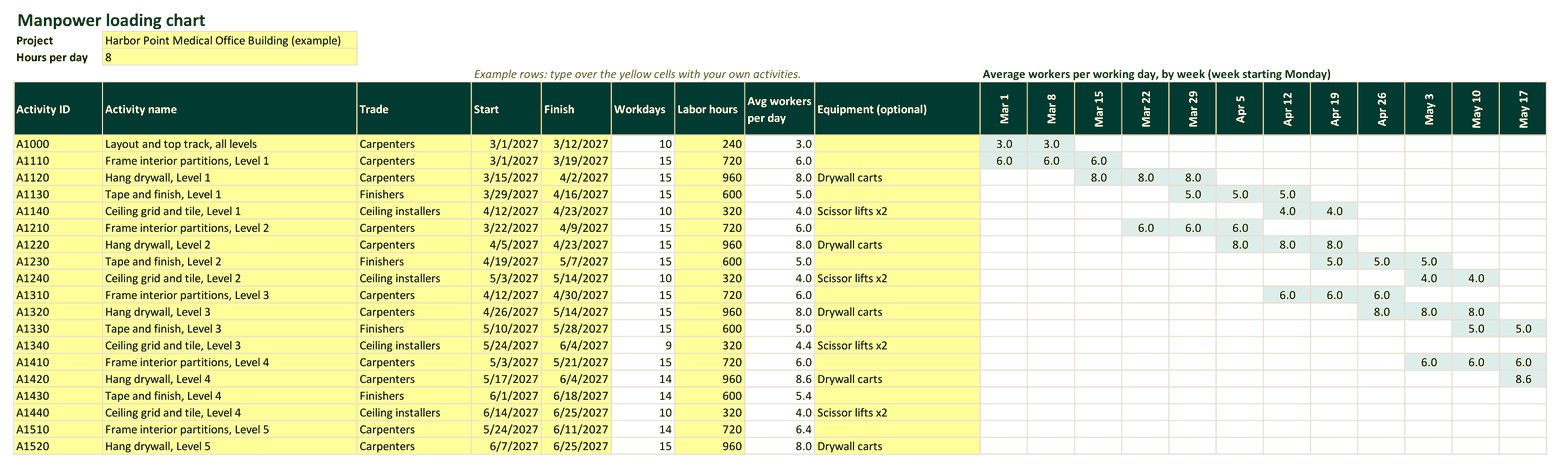
- Loading Chart. One row per activity: ID, name, trade, start, finish, labor hours and an optional equipment column. Workdays and average workers per day are worked out for you, and a 52-week grid spreads each activity's crew across the weeks it runs. Rows under the grid add up workers by trade and in total.
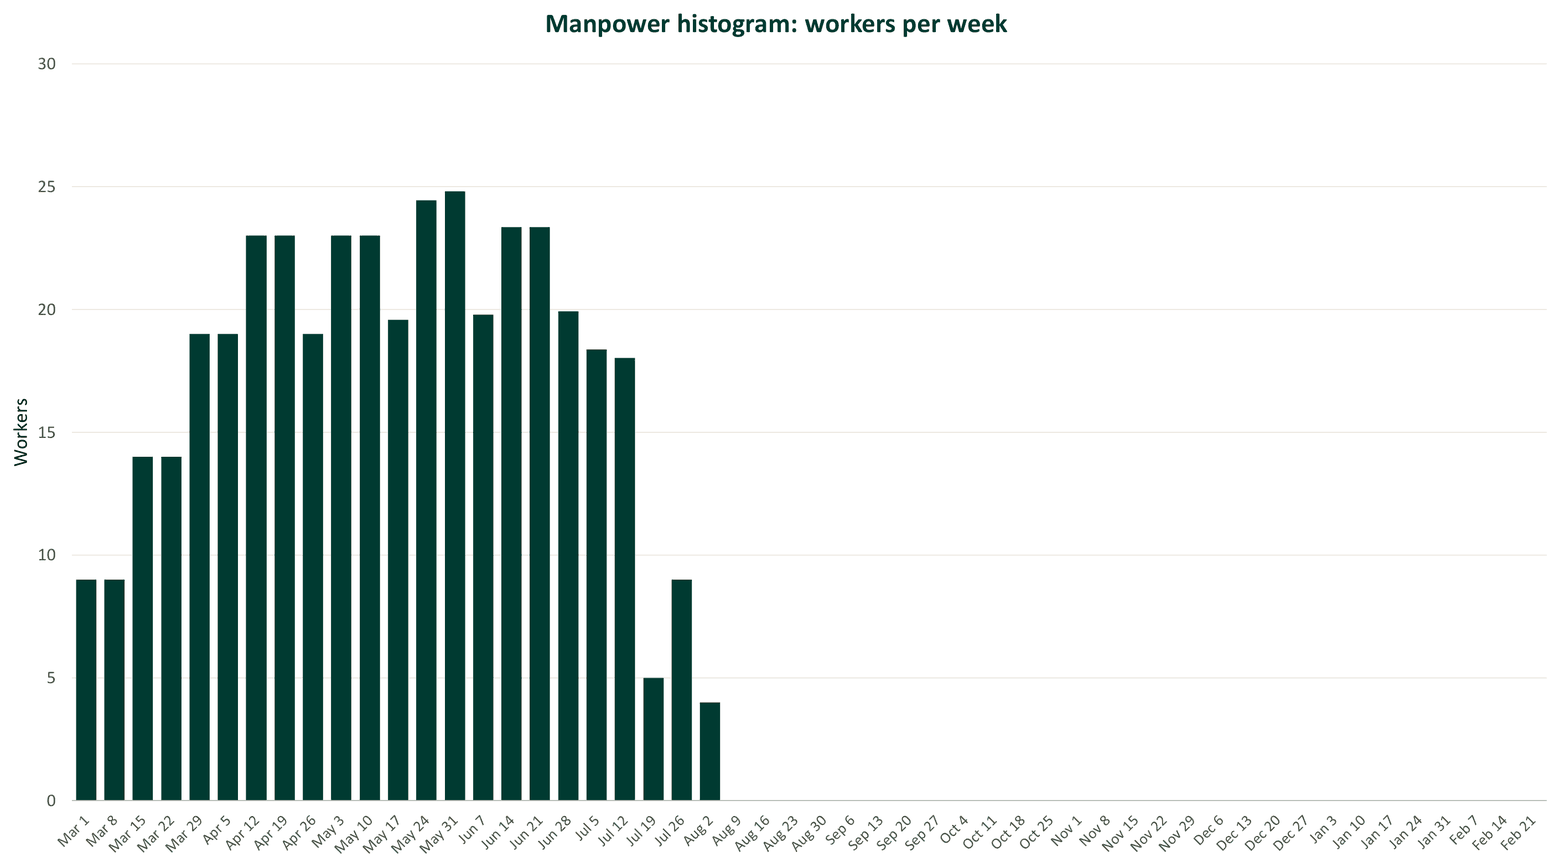
- Histogram. Workers per week as a bar chart, plus total labor hours, peak weekly crew and average weekly crew.
- Monthly. Average and peak workers for each month, for a GC that asks for manpower projections by month.
- Holidays. The days the workday counts skip. It starts with the common US job-site holidays for 2026 to 2028; edit it to match your job calendar.
- How to use. The steps below, inside the file.
The grid holds 60 activities over 52 weeks, starting from the Monday before your first start.
How do I fill it in?
Type in the yellow cells; everything else is worked out for you.
- Copy your activities from the GC's schedule: activity ID, name, start and finish. Keep the GC's IDs so they can match your rows to their schedule.
- Pick the trade for each row. The trade list sits under the grid; type your own trades there and the Trade column offers them as a drop-down.
- Enter the labor hours for each activity from your estimate.
- Set your hours per day (cell B3, 8 to start with).
The template does the rest with one equation: average workers per day = labor hours ÷ workdays ÷ hours per day. In the example, hanging drywall on Level 1 runs 15 workdays with 960 labor hours, so at 8 hours a day it needs 960 ÷ 15 ÷ 8 = 8 workers a day.
Each weekly figure is the average number of workers per working day that week, so a week with a holiday counts four days, not five. Round up when you staff the job: 8.6 workers means 9 people on site.
Manpower and equipment loading chart
Some GCs ask for equipment alongside manpower: the lifts, hoists or cranes each activity needs, so they can plan access and laydown space. The template has an optional Equipment column for that on every activity row. It is a notes column; the template does not total equipment.
What does a GC expect to see?
A GC reviewing a manpower-loaded schedule usually looks for:
- Crew per day or per week, by trade, for the length of your scope.
- Your activities with their dates, workdays and labor hours, using the GC's activity IDs.
- A summary: total labor hours, peak crew, average crew, and the span of your work.
- Your assumptions: hours per day, the workweek, the holidays you take, and which activities are yours and which are by others.
Our guide to what to send back when your GC asks for a manpower-loaded schedule covers what they check before accepting it, and our article on manpower-loaded schedules covers the background.
When is Excel enough?
A spreadsheet works well for a short scope: a few dozen activities, one schedule revision, one job. It gets slow when:
- The GC's schedule is a 40-page Primavera P6 PDF and your scope is spread across hundreds of activities you have to find and retype.
- A revised schedule arrives every month and every date has to be typed again.
- You need one crew forecast across all your jobs.
Labor Loader does those parts for you. It reads the GC's P6 or Microsoft Project schedule, pulls your activities by keyword and builds the same chart. Try it with your schedule, no account needed, or enter dates and hours to see a chart without a schedule.